In Fall 2018, Professor Molly Ball’s History 252: Immigration in the Americas students developed original research based on archival and primary sources to explore how Rochester’s own immigrant history can not only enrich our understanding of the city’s history, but also further our understanding of transnational immigrant experiences throughout the Americas. One of the ways the students’ research has been showcased was in an interactive mapping exhibit.
The Exhibit
The exhibit consists of 3 side by side HD screens. Two screens show mapping applications while the 3rd has instructions for using the maps as well as general information about the project. The 2 maps are:
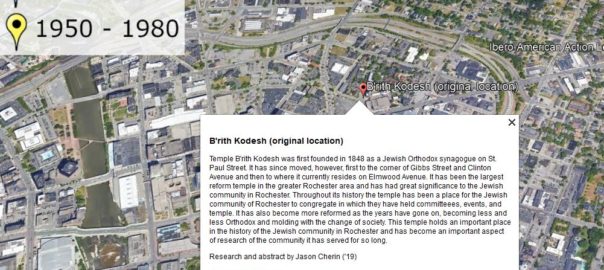
- A fly through tour that moves from point to point displaying information about each point
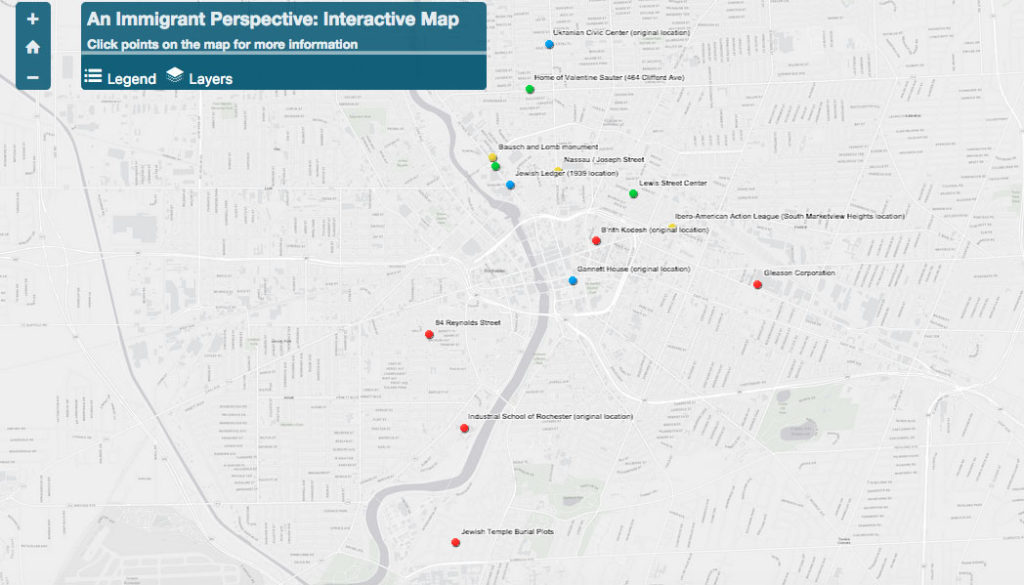
- An interactive map showing the same content but with the added functionality of being clickable and having layers that can be turned on and off

The Technology
This project and associated exhibit required us to make some interesting technological choices: how data would be stored and updated, which mapping applications to use and how the data and applications would be configured for the exhibit.
Data format, storage and update
In addition to the temporary exhibit, this project will continue on and be updated as new data is collected by students in future classes. Comma separated values (CSV) data are easily read by speadsheets, statistical software, text editors and GIS and mapping applications. While CSV may not be the ideal format for large, data intensive projects, it’s flexibility and ease of use led us to use it here. The Library offers Digital Scholar as a web hosting solution for researchers (powered by Reclaim Hosting) which we leveraged to allow easy updates of the CSV data and to make it accessible to other applications.
Mapping applications
We experimented with several solutions for the mapping applications including:
- ArcGIS Online: not great looping fly through options without significant coding
- Google: google maps look and feel not ideal for interactive map and lacks some dynamic layering functionality
- OpenLayers: required a fair amount of scripting and could not get smooth fly through
The fly-though uses Google Earth as it is flexible, has an engaging look and feel and works with the CSV data (with some tweaking discussed below).
ArcGIS Online-
The interactive map leverages ArcGIS Online for several reasons. First it requires no coding which simplified and sped up the development of that part of the exhibit. It also provides the required functionality (layers can be turned on and off based on time frame, dynamic legend) and had the proper look and feel. ArcGIS Online maps also work natively with CSV (added as a “web layer”) so that whenever the data gets up dated, the map will update as well.
Google Earth-
Google Earth requires KML for proper display and tour actions so a small python/flask application (this post by Tony Hirst helped get this set up) that converts the CSV data into a KML network link file. Add the network link to Google Earth by going to the “Add” menu and choosing “Network Link” and pasting the URL:
http://apps.mball.digitalscholar.rochester.edu/kml-write?legend=1
You can also download a standalone KML file the will point to the network link and can be opened by double clicking or dragging into Google Earth.
The exhibit
The screens for the exhibit are high resolution (2160×3840) and have software limitations as they are designed for touchscreen exhibits. The fly-through in Google Earth needed to be locked (non click-able) and run on a loop. Running the tour in Google Earth would require stepping outside of the display software which would make the application clickable (which we did not want). The solution was to create a high resolution video from a Google Earth tour and play it on a loop.
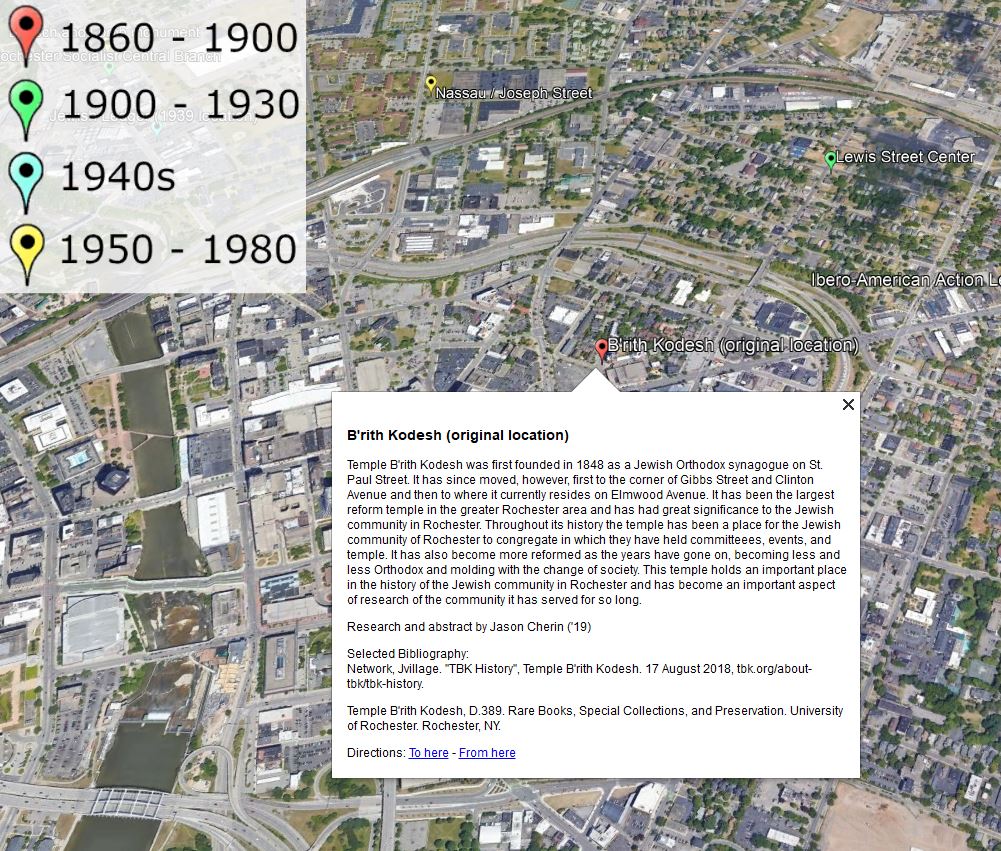
Google Earth Movie Maker does let you set the resolution of the export but unfortunately it does not show information balloons when it exports the movie (even if you have it set to display balloons). Screen capture video software (recommended by some) did not work either. The solution was to create text boxes as images and place them as screen overlays in the KML. This had the added benefit that the screen overlays can be positioned and scaled in the KML.
The Google Earth tour can either be run in “movie” mode or standard. The “movie” mode increases the size of the markers and fonts, uses images for information (described above) and shifts the camera view to fit the portrait style of the exhibit. To get KML appropriate for movie creation you can add mode=movie to the query string in the network link.
http://apps.mball.digitalscholar.rochester.edu/kml-write/?mode=movie
The legend (which is a screen overlay image) can also be turned on and off by setting the legend parameter to 1 or 0.
http://apps.mball.digitalscholar.rochester.edu/kml-write/?legend=1
All the pieces together
The diagram below lists all the components of the workflow. Each piece is clickable and links to that part of the process.