The Digital Scholarship Lab collaborated with professor Carmala Garzione (Earth and Environmental Sciences) to create an exercise for her sedimentology course to examine sea level change’s impact on geologic formation. The goals for the exercise were:
- Must be completed in one course period
- Expose students to open source GIS tools
- Show students where to download open source data
- Allow students to visualize sea level change ranging from -100m to +6m to answer associated questions posed by the professor
Software
We chose the open source GIS software QGIS for this class exercise for a few reasons. As an academic institution we encourage the use and support of open source tools and software when possible. QGIS is also multi-platform which makes it very flexible and accessible for students running a variety of operating systems. In addition QGIS can be installed on any computer free of charge, and will remain usable even once the students leave the university.
Data
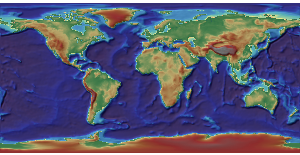
We introduced the class to the National Geophysical Data Center ‘s download interface. This tool provides access to ETOPO1 data (global coverage at low resolution) as well as higher resolution (US Only) coastal relief models which combine. These data sets combine both bathymetry (water depths) and topography (land elevations) in a seamless layer making it easier to examine changing sea levels.
The Process and Results
For the exercise the students had to:
- Download data from the interface matching the area of interest
- Load the data into QGIS and duplicate layers
- Symbolize the layers to represent varying sea levels
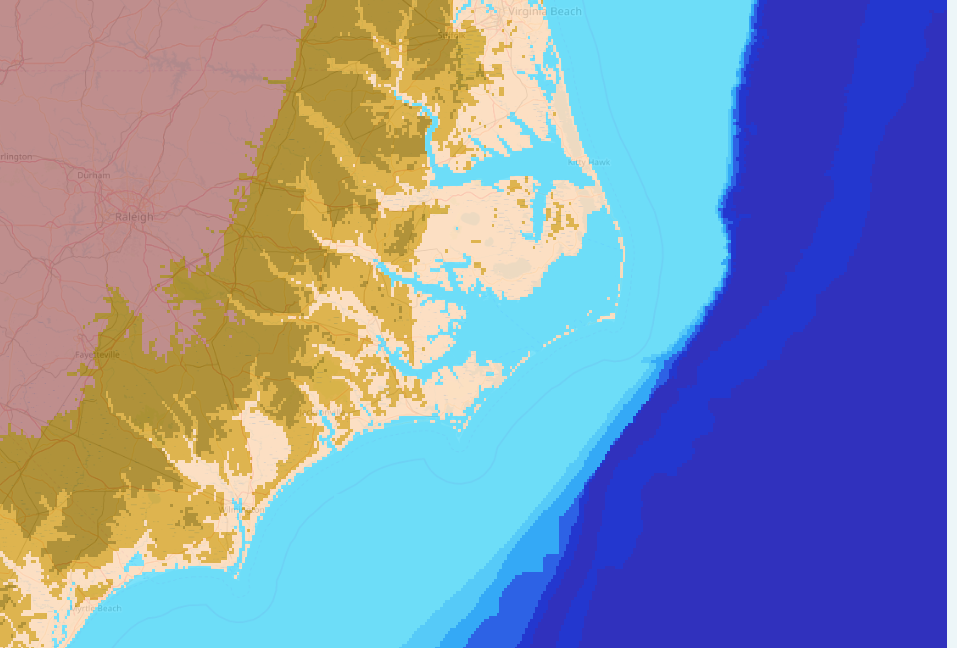
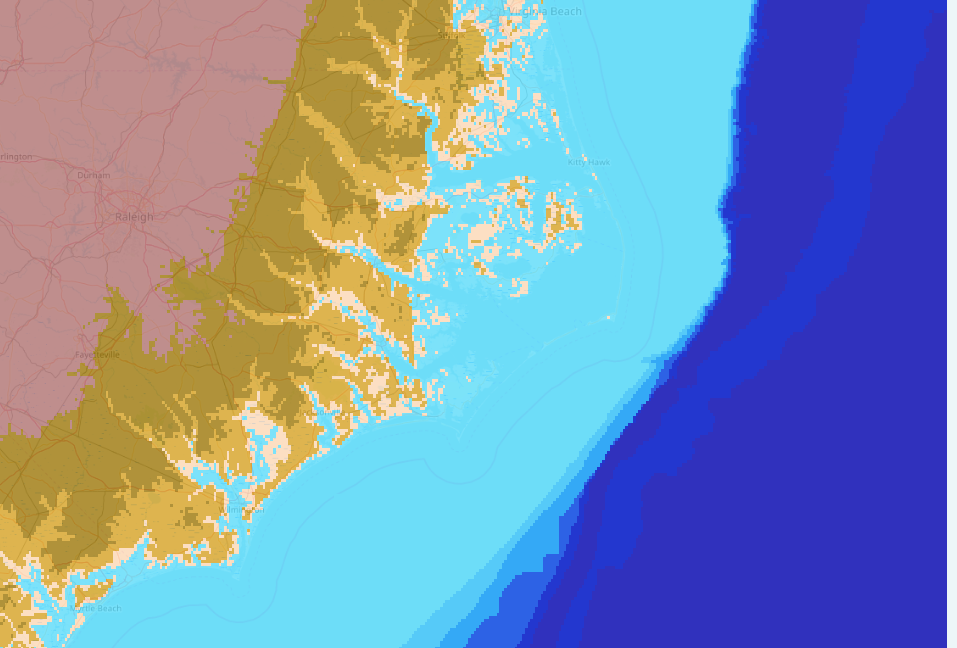
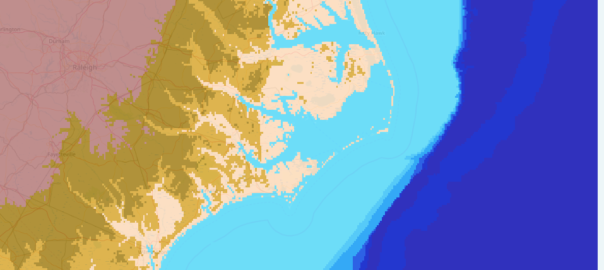
- Analyze the results and answer lab questions
The maps below represent some of the maps created by the students in the class to aid them in answering the lab questions.